// #comment: Since Acces does not offer a trendline and in Excel the graph is a little less good looking with only episode ID-s, I put both types of graphs here, and I also added a graph with both ratings and viewers, but I think it’s a little overcrowded, just illustrates the together running of the curves. If someone wants to obtain the whole ratings DB or Excel sheets of NCIS:LA, I can share it. #end comment //
NCIS: Los Angeles
In every year there are higher rated and more watched episodes and ratings lowpoints. None of my statements address the quality of the episodes, only the ratings.
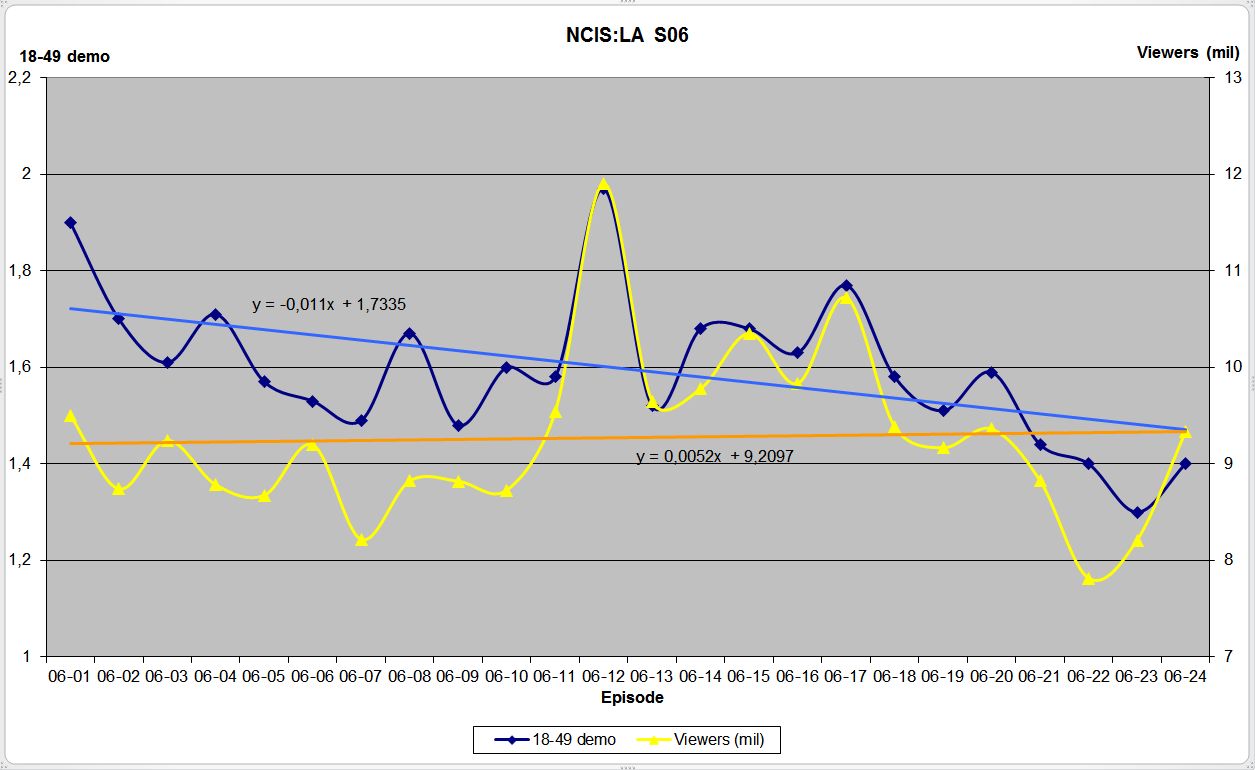
NCIS:LA S06 18-49 demo ratings and total viewers
The first graph above contains the total viewers and rating of every episode of our favorite show. The trendlines are telling an interesting story. As the trendline equasions show, the demo trendline is in decline, but the steepness is only -1,1 %, that is a lot less, than most shows have (NCIS: -3,04%, NCIS: NO: -3,31 % for example). The total viewers trendline on the other hand is almost flat, ascending with +0,52 % steepness (only for comparison: NCIS: -12,28 %, NCIS: NO: -13,94 %).
A few fun facts: S06E12 had the biggest audience and rating, while S06E22 had the smallest audience and S06E23 the lowest rating, both series minimums. The average 18-49 demo rating in this season is 1,59625. The total viewers average is 9,2755 million.
I had a little time and had fun with Access and a little data mining, so the next 2 graphs show the ratings since the show’s premiere.
First one is the 18-49 rating, the two outstanding entries are glitches, these were double episodes on the same day, and the graph creator summed them because it is based on air date, not season-episode number. Cutting them in half will give a good average for those two. The descending trend is obvious even without a trendline, but that is normal for almost every show. The trendline is descending, but only with a -1,56 % steepness.
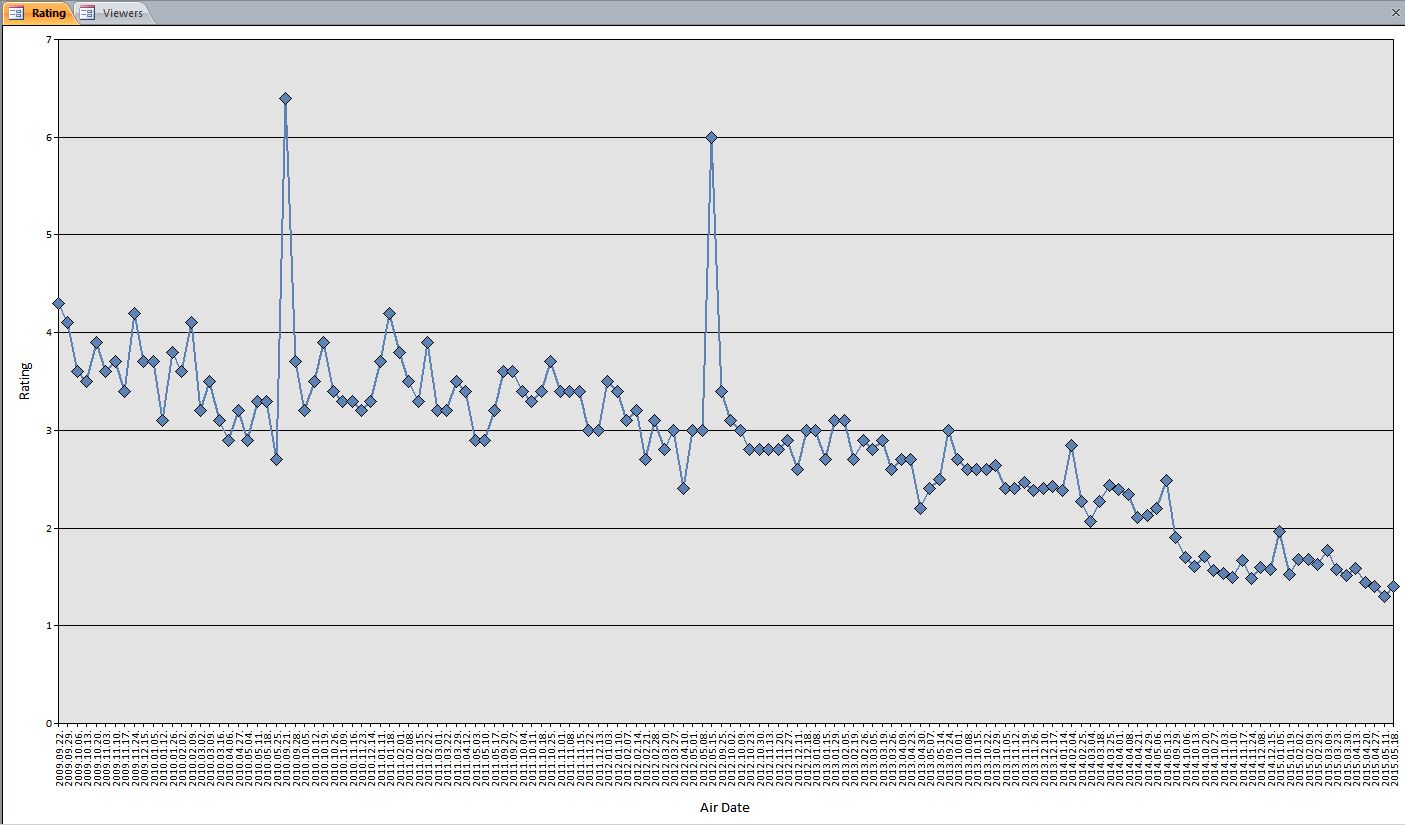
18-49 demo ratings
The same graph with trendline and episode ID:
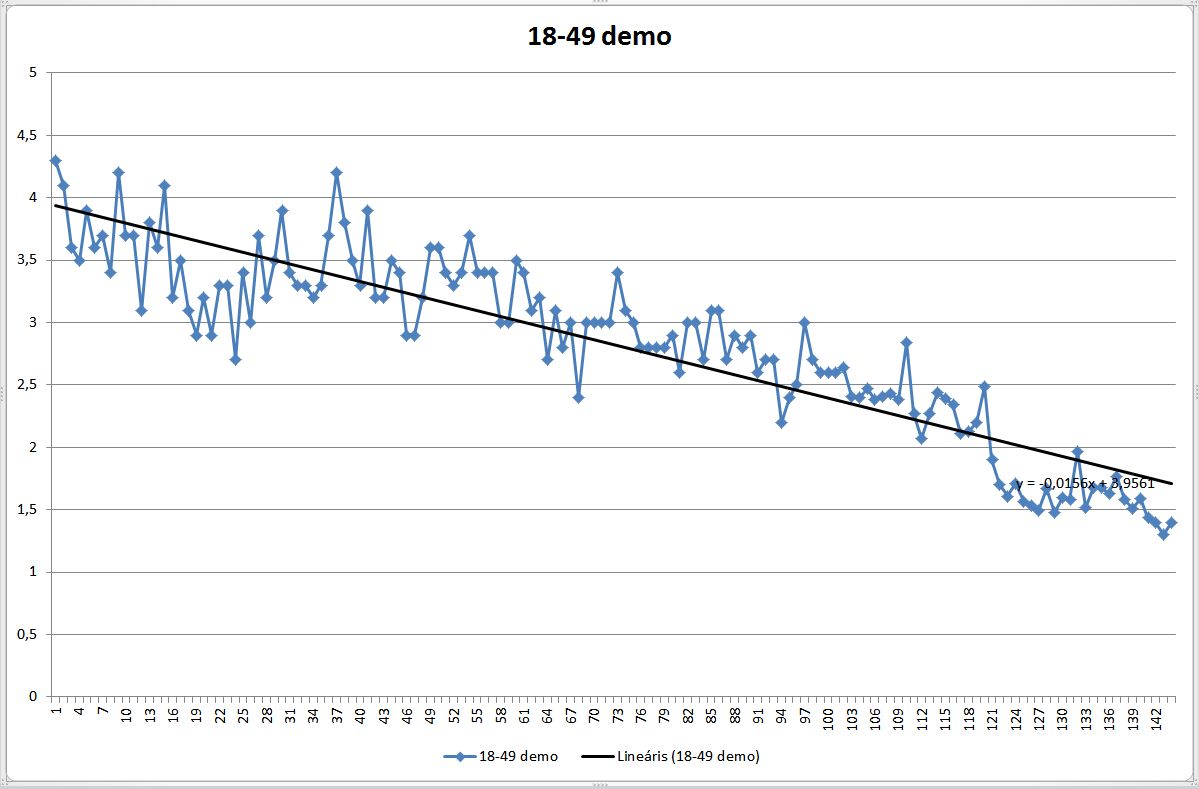
18-49 demo ratings
Opposed to the 18-49 demo, the total viewers graph seemingly had very little decline on Tuesday nights along the years (the same 2 glitches are present here too, cutting them in half puts those days in line too), and as was mentioned above, it was stable at a lower level after moving to Monday nights too, but the nearly 40 % drop after the move means a -4,51 % steepness for the descending trendline.
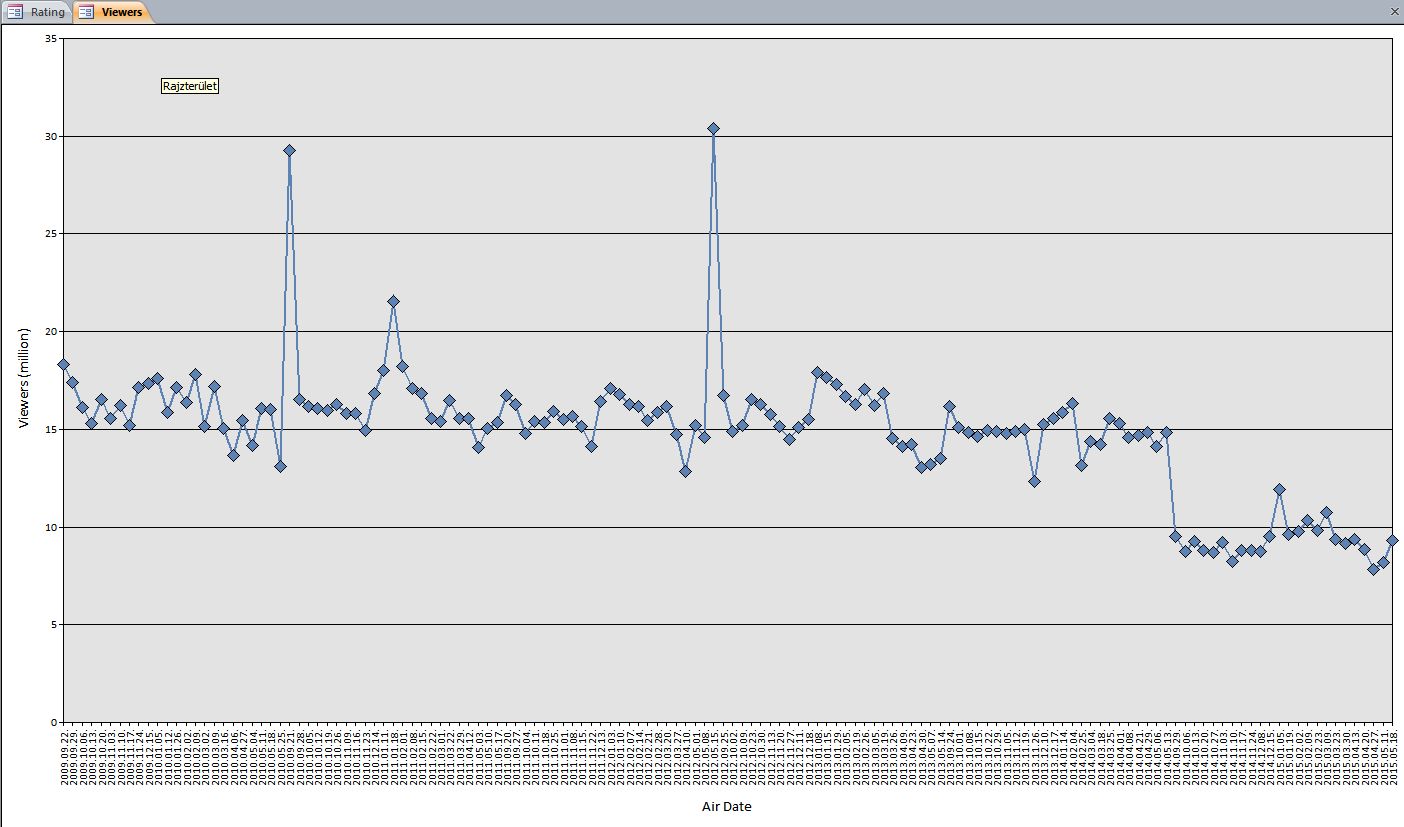
Total viewers
And the same graph in Excel with trendline:
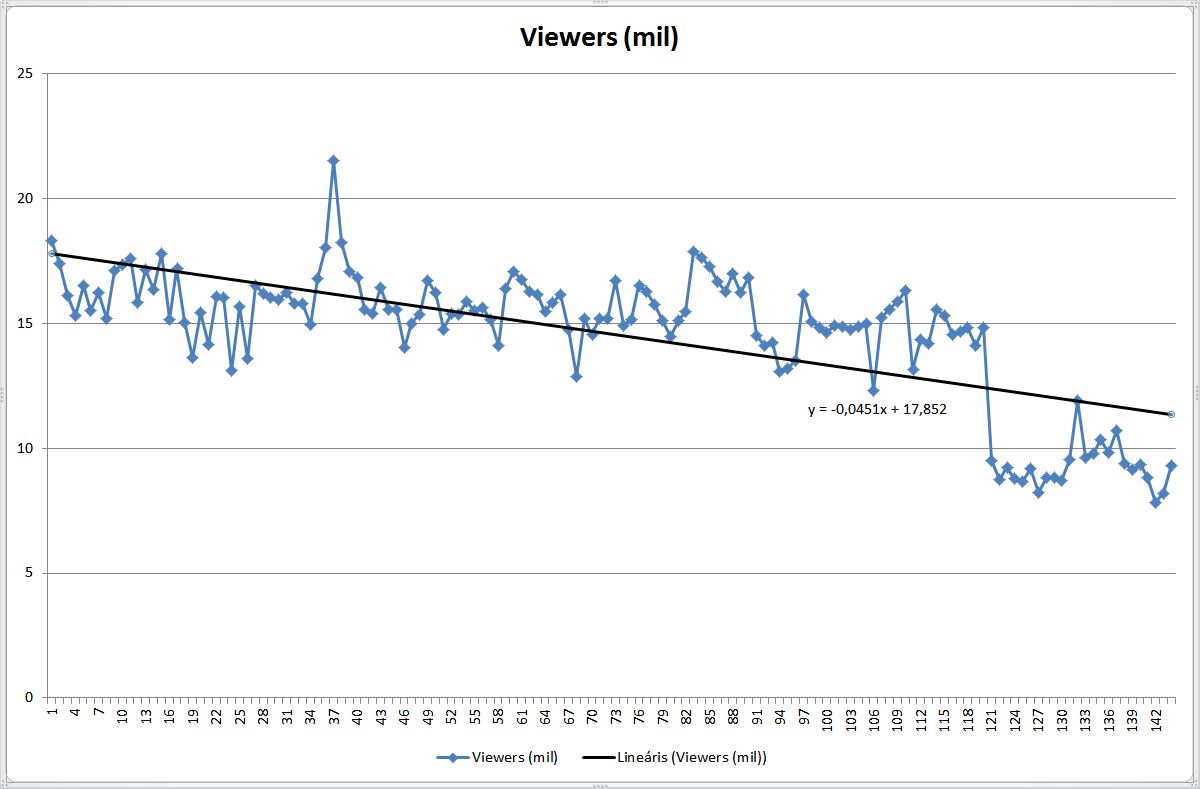
Total viewers
18-49 rating and total viewers in one graph. Rating on the left axis, viewers on the right axis. Please mind the 1.0 starting point for the rating axis and the 5 million starting point for total viewers.
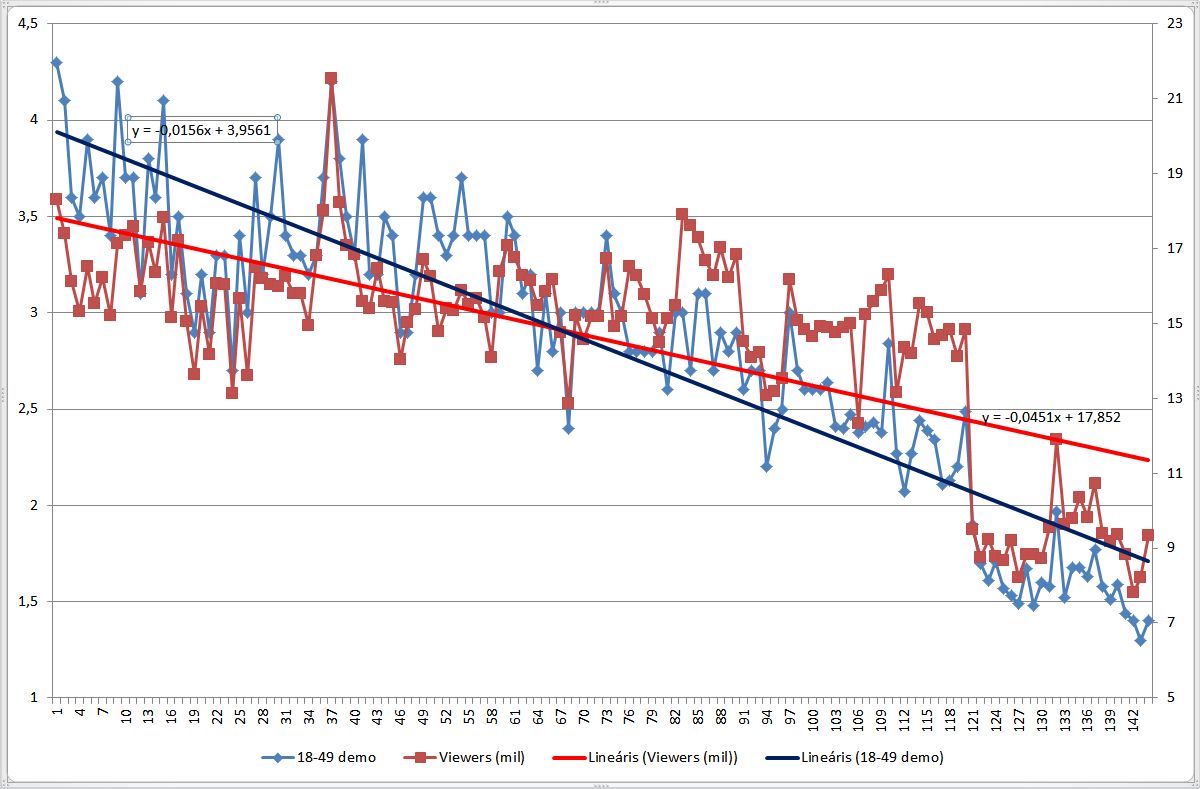
18-49 demo and total viewers with trendlines
Season 7 is in progress, and unfortunately the numbers went down a little bit. Let’s hope the best, I’d like to see double-digit season numbers, and I’m pretty sure, I’m not the only one.
Monday 22:00 18-49 demo
Monday night’s winner in the demo was undoubtedly The Blacklist. But it was there only for 8 episodes, and later collapsed on Thursday. The Blacklist’s demo trendline has a descending steepness of -11,6 %, which comes from the very high premiere, later it levelled out around 2,5 rating. Average 18-49 demo rating on monday: 2,6875.
Second place goes to NCIS: Los Angeles with it’s average of 1,59625 mentioned above.
Castle had it’s premiere together with NCIS: LA and they had similar demo ratings in average. In 2014 Castle had more demo, in 2015 the table turned. The 18-49 demo rating average for Castle is 1,575, slightly lower than NCIS: LA.
State of Affairs arrived in the timeslot after The Blacklist was moved, but it couldn’t keep up with the competition – this show had the worst demo ratings in the season in this timeslot. It’s trendline has a decline steepness of -7,73 % and averaged 1,25 rating in the 18-49 demo.
The Night Shift was the last show to arrive, and it did a little better than State of Affairs. It’s trendline is declining as usual, but the steepness is only -1,77 %. Also it had a little better 18-49 demo rating average than it’s predecessor: 1,31.
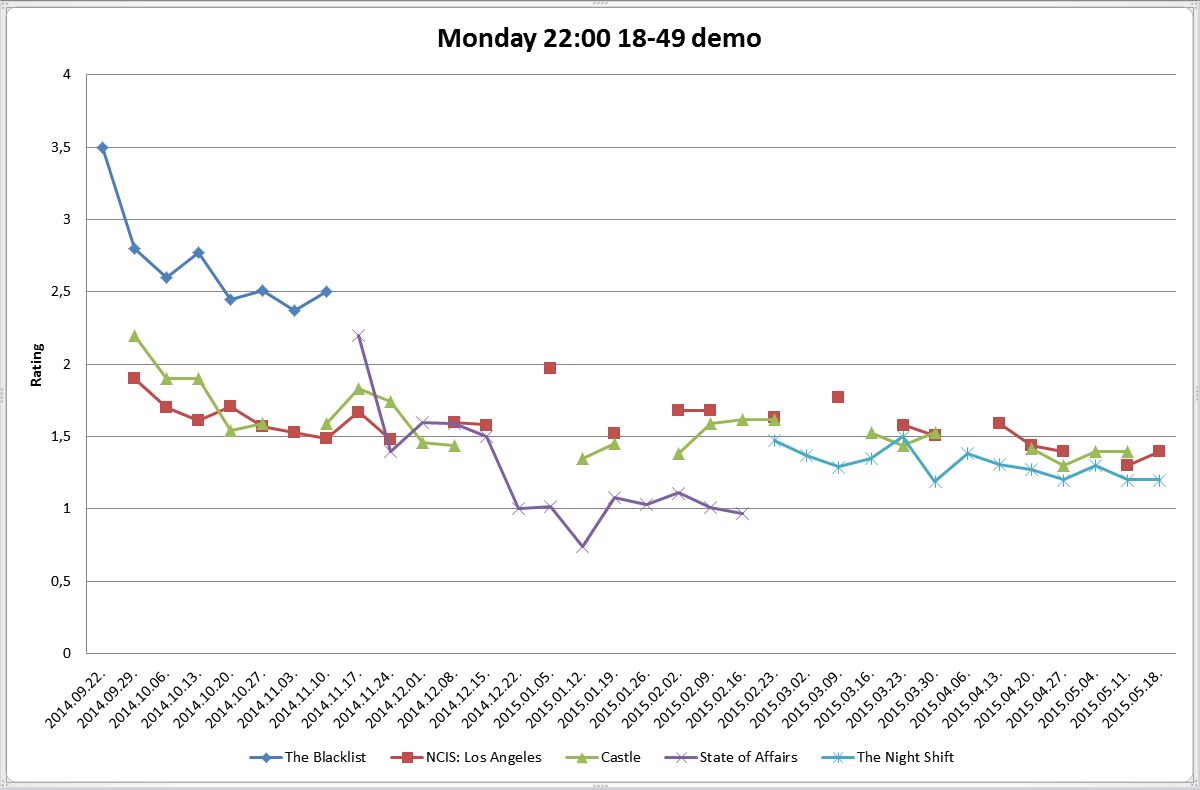
Monday 22:00 18-49 demo (2014/2015)
Monday 22:00 Total viewers
The total viewers graph is similar to the demo ratings. The Blacklist had the biggest audience with it’s premiere in the timeslot, and also the best average: 10,0973 million. The trendline is very similar to the demo trendline, it’s declining steepness is -32,62 %(!), but that comes from the very high premiere, it levelled out between 9 and 10 million viewers.
The silver medal goes once again to NCIS: LA with it’s average of 9,2755 million.
Castle has a decline steepness of -4,42 % in it’s total viewers graph, and it averaged a 8,47 million audience earning the third place in the timeslot. For some reason the viewers fled from the show in december and only a part of them returned later in the spring.
State of Affairs premiered to a large audience, but it quickly fell into a gorge with a decline steepness of -28,21 %, and just like in the demo rating, this show has the smallest audience, with an average of 5,2609 million viewers.
The Night Shift had a much more stable audience than State of Affairs, with an average of 5,3814 million viewers, and with only a -4,68 % steep decline in its trendline.
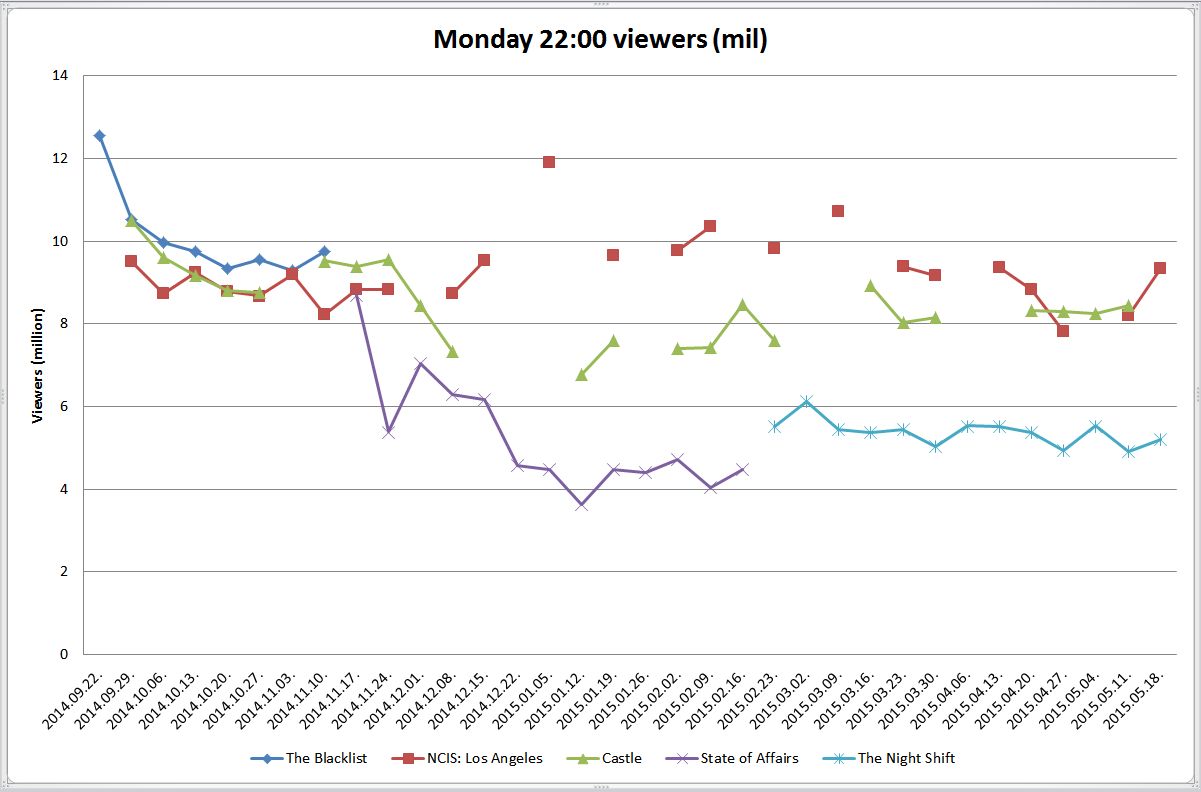
Monday 22:00 total viewers (2014/2015)

![ncisla.6x08[11-03-29]](http://www.ncislamagazine.com/wp-content/uploads/2014/11/ncisla.6x0811-03-29.jpg)